
Monday, June 27, 2011
Research No. 2
Chapter 3 (System Buses)
1. What is the function of Control Unit
2. Components of a Control Unit
3. What is Interrupts
4. What is a system Bus
4.1. Data bus
4.2 Address bus
4.3 Control bus
5. Types of Bus
Filename: Research2_chapter3
use the research template and send it to this e-mail address: hubssup at gmail dot com
Thursday, June 23, 2011
Activity 2
1. Open a new workbook, in your sheet1 enter the data below:

2. Create a chart and follow the sample chart below:
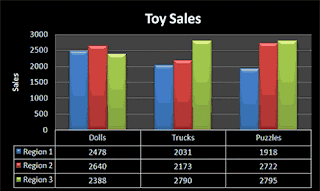
3. Rename your sheet1 to ToySales
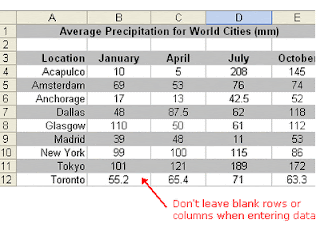
4. Select sheet number 2 and enter the data below
5. Create a chart from the given data.
6. Create a chart for the month of January Only
7. Add color and change the font style and size.
8. Save your File under the filename: Activity2_Chart


2. Create a chart and follow the sample chart below:

3. Rename your sheet1 to ToySales
4. Select sheet number 2 and enter the data below

5. Create a chart from the given data.
6. Create a chart for the month of January Only
7. Add color and change the font style and size.
8. Save your File under the filename: Activity2_Chart
Monday, June 13, 2011


Sunday, June 12, 2011

Subscribe to:
Comments (Atom)
Visitor
