Kindly check the link below for sample business plan:
http://www.bplans.com/photography_studio_business_plan/executive_summary_fc.cfm
Thanks..
Sunday, July 31, 2011
Friday, July 29, 2011
Java 3-5
1. Create a program that will convert pounds to kilograms
2. Create a program that will convert meters to cm
Note: Your output will be checked next meeting
CS1 - BSIT1 10-12
1. Get one whole sheet of paper
2. Research the following number system:a. Hexadecimal
b. Octal
conversion of number system:
1. Binary to Octal
2. Octal to Binary
3. Hex to Octal
4. Octal to binary
Give 1 example on each conversion
Wednesday, July 27, 2011

Tuesday, July 26, 2011
Slide #1
Click in the “Click to add title” section and key in Microsoft.
Click in the “Click to add subtitle” section and key in the following:
A Corporate Research Project
Presented by (key in your name)
Click New Slide Icon on the top right of your screen
Slide #2
From text layouts, select Title and Text Slide
Click in the “Click to add title” section and key in Introduction
Click in the “Click to add text” section and key in the following:
Description of Business
History
Major Competitors
Click New Slide Icon on the top right of your screen
Slide #3
From text layouts, select Organization Chart Slide (near bottom of layouts)
Click in the “Click to add title” section and key in Top Corporate Management
In uppermost box key in: William H. Gates, III
Chairman of the Board
In left hand box key in: Richard F. Rashid
Senior Vice President, Research
In center Box key in: Steve A. Ballmer
President and Chief Executive Office
In Right Box key in: John Connors
Senior Vice President and Chief Financial Officer
Click New Slide Icon on the top right of your screen
Slide #4
From text layouts, select Title, Text and Clip Art Slide
In “Click to add title” section key in Microsoft Culture
In “Click to add text” section key in the following:
Innovative
Creative
Intense
Non-Traditional
Competitive
Double click to add clip art and select an icon of your choosing
Click New Slide Icon on the top right of your screen
Slide #5
From text layouts, select Title, Chart Slide
In “Click to add title” section key in Revenues and Net Income History
Double click to add chart
Enter the following data in the table provided:
2000 2001 2002
Net Revenues $22,956 $25,296 $28,365
Net Income 9,421 7,346 7,829
Delete any extra columns and rows.
Click New Slide Icon on the top right of your screen
Slide #6
From text layouts, select Title and Text Slide
In “Click to add title” section, key in Segment Revenue for 2002 and center
In “Click to add text” section key in the following:
Desktop and
Consumer Software and Services 3,531
Consumer Commerce and Investments 245
Other 537
Reconciling Amounts 266
Total Revenue $28,365
Click New Slide Icon on the top right of your screen
Slide #7
From text layouts, select Title and Text Slide
In “Click to add title” section key in Microsoft and the Accounting Equation – 2002
In the “Click to add text” box key in the following:
Assets = Liabilities + Stockholders’ Equity
$67,646 $15,466 $52,180
Click New Slide Icon on the top right of your screen
Slide #8
From text layouts, select Title and Text Slide
In “Click to add title” section, key in Common Stock Growth Potential
In the “Click to add text” section key in the following bullets:
Growth is strong
Company is aggressively expanding
Revenue is expanding
New products are being developed
Click New Slide Icon on the top right of your screen
Slide #9
From text layouts, select Title and Text Slide
In “Click to add title” section, key in Outlook for the future
In the “Click to add text” section key in the following:
Legal Issues and Uncertainties
Security
Rapid Technological Change
Uncertain Market Conditions
Customer Acceptance
Market Saturation
Research and Development
Delete any unneeded slides
Select View, Slide Sorter
Click to activate any unneeded slides and Delete
Select Slide Sorter View Button at bottom left of screen
From Edit Pull Down Menu, select all slides
From Menu Bar select Format and Apply Design Template
From Designs, select an appropriate background. Select Apply
From Slide Show Pull Down Menu, select Slide Transition and Cover Right
Run Slide Show
From Menu Bar select Slide Show and View Show
To Receive Credit for this assignment
Save to Desktop and send it to me in the internal class email system.
Filename: Revenue_2002
Tuesday, July 19, 2011
Exercise 1 & 2 POWERPOINT
Attention!!! HRM 8-9, IT401 11-12, CS1 4-5
Click the link below and read the instruction carefully.
Exercise 1
Filename: PptExer1
Exercise 2
Filename: PptExer2
Sunday, July 17, 2011
Sunday - OS
Roles of the operating system
•Management of input/output
•Management of execution of applications
•Management of authorizations File m
anagement
•Information management
•The kernel,
•The shell
•The file system
Font type: Arial
Font size : 12
Spacing : 1.5
Page Format:

Friday, July 15, 2011

Wednesday, July 6, 2011

1. The 4th grading grade is computed as follows:
40% for the Quiz
30% for Exam
20% for Assignment
10% for Attendance
Therefore 4th grading grade = Quiz*40%+Exam*30%+Assignment*20%+Attendance*10%
2. Format the grades to 2 decimal digit.
3. Rename this sheet to grades.
4. Sort the name according to ascending order.
5. Save this under the same filename.
Tuesday, July 5, 2011
CS1 4-5
a. Open a new workbook
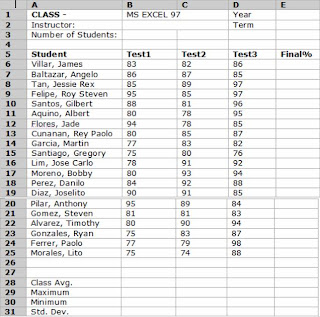 .
.
b. In your sheet1 enter the following data
. 1. On cell E1, type the current year. Type your instructor's name on cell B2 and the current term on E2.
2. On cell C3, use the count function to count the number of students. For your range, use cells B6:B25 instead of A6:A25.
3. Get the Final average per student. Format the numbers into 1 decimal digits.
4. Get the maximum, minimum value of each test. Format the number into zero decimal digits.
5. Get the Standard deviation value of each test. Format the number into zero decimal digits.
6. Name this sheet GRADES.
7. Protect this worksheet.
8. Save this under the filename STUDENT.
Sunday, July 3, 2011
HRM 8-9
a. Open a new workbook.
b. Do the following on sheet1.
c. Enter all given data.


1.) Compute for the following.
a. Monthly Projection (Value of Return*1.75)
b. Monthly Projection (Value of Sales * 1.25)
2.) Total NET SALES (Summation of components of INCOME)
3.) Cost of Good Sold:
a. Values of Materials * 0.95
b. Values of Merchandise * 0.75
c. Values of Commission * 0.60
4.) Total GROSS PROFIT (Summation of components of COST OF GOODS SOLD)
5.) Value of Components of EXPENSES * 0.88
6.) Total EXPENSES (Summation of components of EXPENSES).
7.) NET PROFIT (TOTAL EXPENSES – GROSS PROFIT)
8.) NET INCOME (NET PROFIT – TAXES)
Subscribe to:
Comments (Atom)
Visitor
